自宅の環境にPrometheusを導入してみたくなり、まずは使ってみることにしました。
前提
この記事は以下のバージョンを前提にしています。
- Ubuntu 18.04.2 LTS
- Prometheus 2.8.0
- Node Exporter 0.17.0
Prometheusインストール・起動
PrometheusはGoで開発されているので、バイナリと設定ファイルがまとまったtar ballをダウンロードし、設定を修正後にバイナリを実行すればよいです。
ubuntu@prom:~$ wget https://github.com/prometheus/prometheus/releases/download/v2.8.0/prometheus-2.8.0.linux-amd64.tar.gz
ubuntu@prom:~$ tar -xzf prometheus-2.8.0.linux-amd64.tar.gz
ubuntu@prom:~$ cd prometheus-2.8.0.linux-amd64
ubuntu@prom:~/prometheus-2.8.0.linux-amd64$ ls -l
total 103492
-rw-r--r-- 1 ubuntu ubuntu    11357 Mar 12 09:01 LICENSE
-rw-r--r-- 1 ubuntu ubuntu     2770 Mar 12 09:01 NOTICE
drwxr-xr-x 2 ubuntu ubuntu     4096 Mar 12 09:01 console_libraries
drwxr-xr-x 2 ubuntu ubuntu     4096 Mar 12 09:01 consoles
-rwxr-xr-x 1 ubuntu ubuntu 65272078 Mar 12 07:48 prometheus
-rw-r--r-- 1 ubuntu ubuntu      926 Mar 12 09:01 prometheus.yml
-rwxr-xr-x 1 ubuntu ubuntu 40669742 Mar 12 07:49 promtool
ubuntu@prom:~/prometheus-2.8.0.linux-amd64$
ubuntu@prom:~/prometheus-2.8.0.linux-amd64$ ./prometheus
level=info ts=2019-03-23T04:55:54.749581666Z caller=main.go:285 msg="no time or size retention was set so using the default time retention" duration=15d
level=info ts=2019-03-23T04:55:54.749670041Z caller=main.go:321 msg="Starting Prometheus" version="(version=2.8.0, branch=HEAD, revision=59369491cfdfe8dcb325723d6d28a837887a07b9)"
level=info ts=2019-03-23T04:55:54.749700665Z caller=main.go:322 build_context="(go=go1.11.5, user=root@4c4d5c29b71f, date=20190312-07:46:58)"
level=info ts=2019-03-23T04:55:54.74972578Z caller=main.go:323 host_details="(Linux 4.15.0-46-generic #49-Ubuntu SMP Wed Feb 6 09:33:07 UTC 2019 x86_64 prom (none))"
level=info ts=2019-03-23T04:55:54.749750667Z caller=main.go:324 fd_limits="(soft=1024, hard=1048576)"
level=info ts=2019-03-23T04:55:54.749773265Z caller=main.go:325 vm_limits="(soft=unlimited, hard=unlimited)"
level=info ts=2019-03-23T04:55:54.751990415Z caller=main.go:640 msg="Starting TSDB ..."
level=info ts=2019-03-23T04:55:54.754091703Z caller=web.go:418 component=web msg="Start listening for connections" address=0.0.0.0:9090
level=info ts=2019-03-23T04:55:54.756149846Z caller=main.go:655 msg="TSDB started"
level=info ts=2019-03-23T04:55:54.756182656Z caller=main.go:724 msg="Loading configuration file" filename=prometheus.yml
level=info ts=2019-03-23T04:55:54.756896788Z caller=main.go:751 msg="Completed loading of configuration file" filename=prometheus.yml
level=info ts=2019-03-23T04:55:54.756915881Z caller=main.go:609 msg="Server is ready to receive web requests."
http://ipaddress:9090 を開くと /graphにリダイレクトし expression browerが表示される。ここから PromQLによるクエリを実行できる。
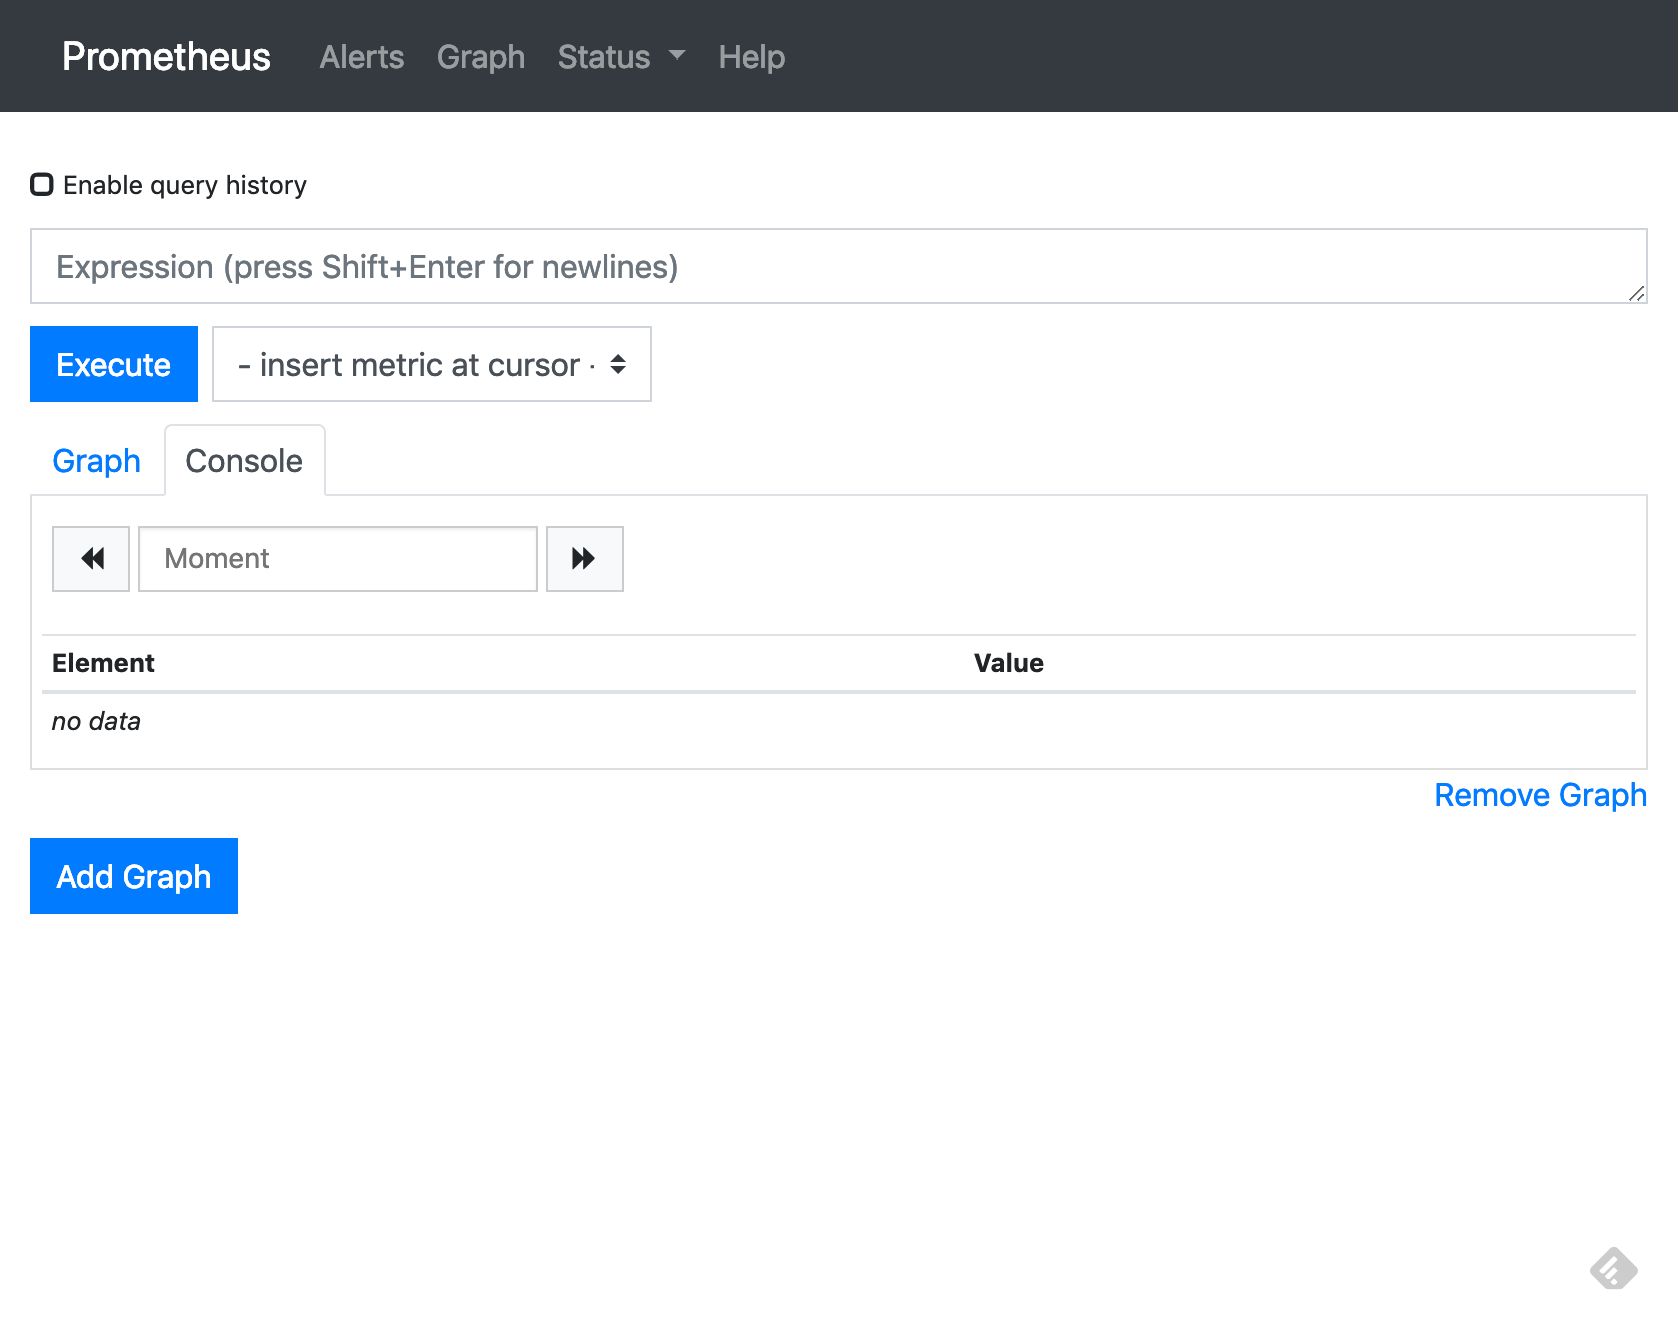
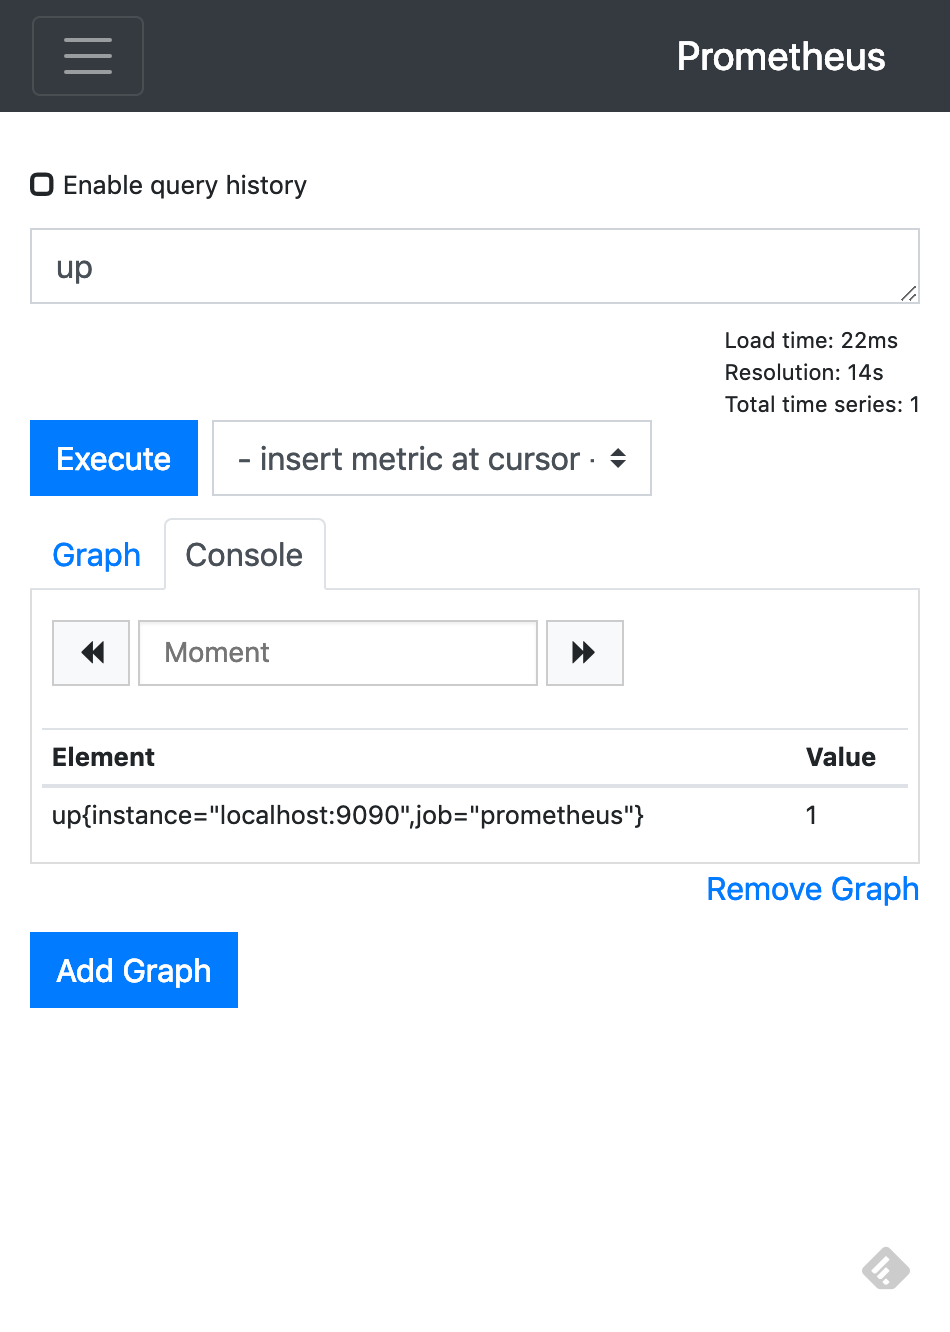
入力フィールドにupを入力し、ExecuteをクリックするとConsoleに
up{instance=”localhost:9090″,job=”prometheus”}の値が1と表示されます。これはprometheus jobのlocalhost:9090 targetのスクレイピングが成功したことを示します。prometheus jobは prometheus自体のmetricです。
これはデフォルトでprometheus.ymlに以下が書かれているためです。
scrape_configs:
  # The job name is added as a label `job=<job_name>` to any timeseries scraped from this config.
  - job_name: 'prometheus'

    # metrics_path defaults to '/metrics'
    # scheme defaults to 'http'.

    static_configs:
    - targets: ['localhost:9090']
Node Exporterのインストール・起動
Prometheusはソフトウェアごとに”Exporter”を動かし、HTTP GETで/metricsからメトリックを取得します。当然Exporterごとにポート番号は異なります。
Exporterにはofficialとそうでないものがあります。Prometheus GitHub organizationにあるものがofficialです。
officialでないもの含めThird-party exportersに一覧が、デフォルトポート番号の一覧はexporter default port wiki pageにあります。
ここではPrometheusを動かしたマシンにマシンメトリックを取得するNode Exporterをインストールします。Node ExporterもPrometheusと同様にバイナリと設定ファイルがまとまったtar ballをダウンロードし、設定を修正後にバイナリを実行すればよいです。
ubuntu@prom:~$ wget https://github.com/prometheus/node_exporter/releases/download/v0.17.0/node_exporter-0.17.0.linux-amd64.tar.gz
$ ubuntu@prom:~$ tar -xvf node_exporter-0.17.0.linux-amd64.tar.gz
$ cd node_exporter-0.17.0.linux-amd64
ubuntu@prom:~/node_exporter-0.17.0.linux-amd64$ ./node_exporter
INFO[0000] Starting node_exporter (version=0.17.0, branch=HEAD, revision=f6f6194a436b9a63d0439abc585c76b19a206b21)  source="node_exporter.go:82"
INFO[0000] Build context (go=go1.11.2, user=root@322511e06ced, date=20181130-15:51:33)  source="node_exporter.go:83"
INFO[0000] Enabled collectors:                           source="node_exporter.go:90"
INFO[0000]  - arp                                        source="node_exporter.go:97"
INFO[0000]  - bcache                                     source="node_exporter.go:97"
INFO[0000]  - bonding                                    source="node_exporter.go:97"
INFO[0000]  - conntrack                                  source="node_exporter.go:97"
INFO[0000]  - cpu                                        source="node_exporter.go:97"
INFO[0000]  - diskstats                                  source="node_exporter.go:97"
INFO[0000]  - edac                                       source="node_exporter.go:97"
INFO[0000]  - entropy                                    source="node_exporter.go:97"
INFO[0000]  - filefd                                     source="node_exporter.go:97"
INFO[0000]  - filesystem                                 source="node_exporter.go:97"
INFO[0000]  - hwmon                                      source="node_exporter.go:97"
INFO[0000]  - infiniband                                 source="node_exporter.go:97"
INFO[0000]  - ipvs                                       source="node_exporter.go:97"
INFO[0000]  - loadavg                                    source="node_exporter.go:97"
INFO[0000]  - mdadm                                      source="node_exporter.go:97"
INFO[0000]  - meminfo                                    source="node_exporter.go:97"
INFO[0000]  - netclass                                   source="node_exporter.go:97"
INFO[0000]  - netdev                                     source="node_exporter.go:97"
INFO[0000]  - netstat                                    source="node_exporter.go:97"
INFO[0000]  - nfs                                        source="node_exporter.go:97"
INFO[0000]  - nfsd                                       source="node_exporter.go:97"
INFO[0000]  - sockstat                                   source="node_exporter.go:97"
INFO[0000]  - stat                                       source="node_exporter.go:97"
INFO[0000]  - textfile                                   source="node_exporter.go:97"
INFO[0000]  - time                                       source="node_exporter.go:97"
INFO[0000]  - timex                                      source="node_exporter.go:97"
INFO[0000]  - uname                                      source="node_exporter.go:97"
INFO[0000]  - vmstat                                     source="node_exporter.go:97"
INFO[0000]  - xfs                                        source="node_exporter.go:97"
INFO[0000]  - zfs                                        source="node_exporter.go:97"
INFO[0000] Listening on :9100                            source="node_exporter.go:111"
http://ipaddress:9100 にアクセスするとNode Exporter文字列が表示されます。
http://ipaddress:9100/metricsからメトリックが取得できます。
ubuntu@prom:~$ curl http://ipaddress:9100/metrics
# HELP go_gc_duration_seconds A summary of the GC invocation durations.
# TYPE go_gc_duration_seconds summary
go_gc_duration_seconds{quantile="0"} 1.4264e-05
go_gc_duration_seconds{quantile="0.25"} 3.9649e-05
go_gc_duration_seconds{quantile="0.5"} 9.7112e-05
go_gc_duration_seconds{quantile="0.75"} 0.000147184
go_gc_duration_seconds{quantile="1"} 0.003614629
go_gc_duration_seconds_sum 0.062631656
go_gc_duration_seconds_count 896
# HELP go_goroutines Number of goroutines that currently exist.
# TYPE go_goroutines gauge
go_goroutines 8
(以下省略)
PrometheusからNode Exporterをモニタする
PrometheusでExporterで公開したメトリックを取得するには、prometheus.ymlを修正し、Prometheusを再起動またはSIGHUPシグナルを送ります。job名はなんでもよいが、ここではnodeとしました。
scrape_configs:
  # The job name is added as a label `job=<job_name>` to any timeseries scraped from this config.
  - job_name: 'prometheus'

    # metrics_path defaults to '/metrics'
    # scheme defaults to 'http'.

    static_configs:
    - targets: ['localhost:9090']

  - job_name: 'node'
    static_configs:
    - targets: ['localhost:9100']
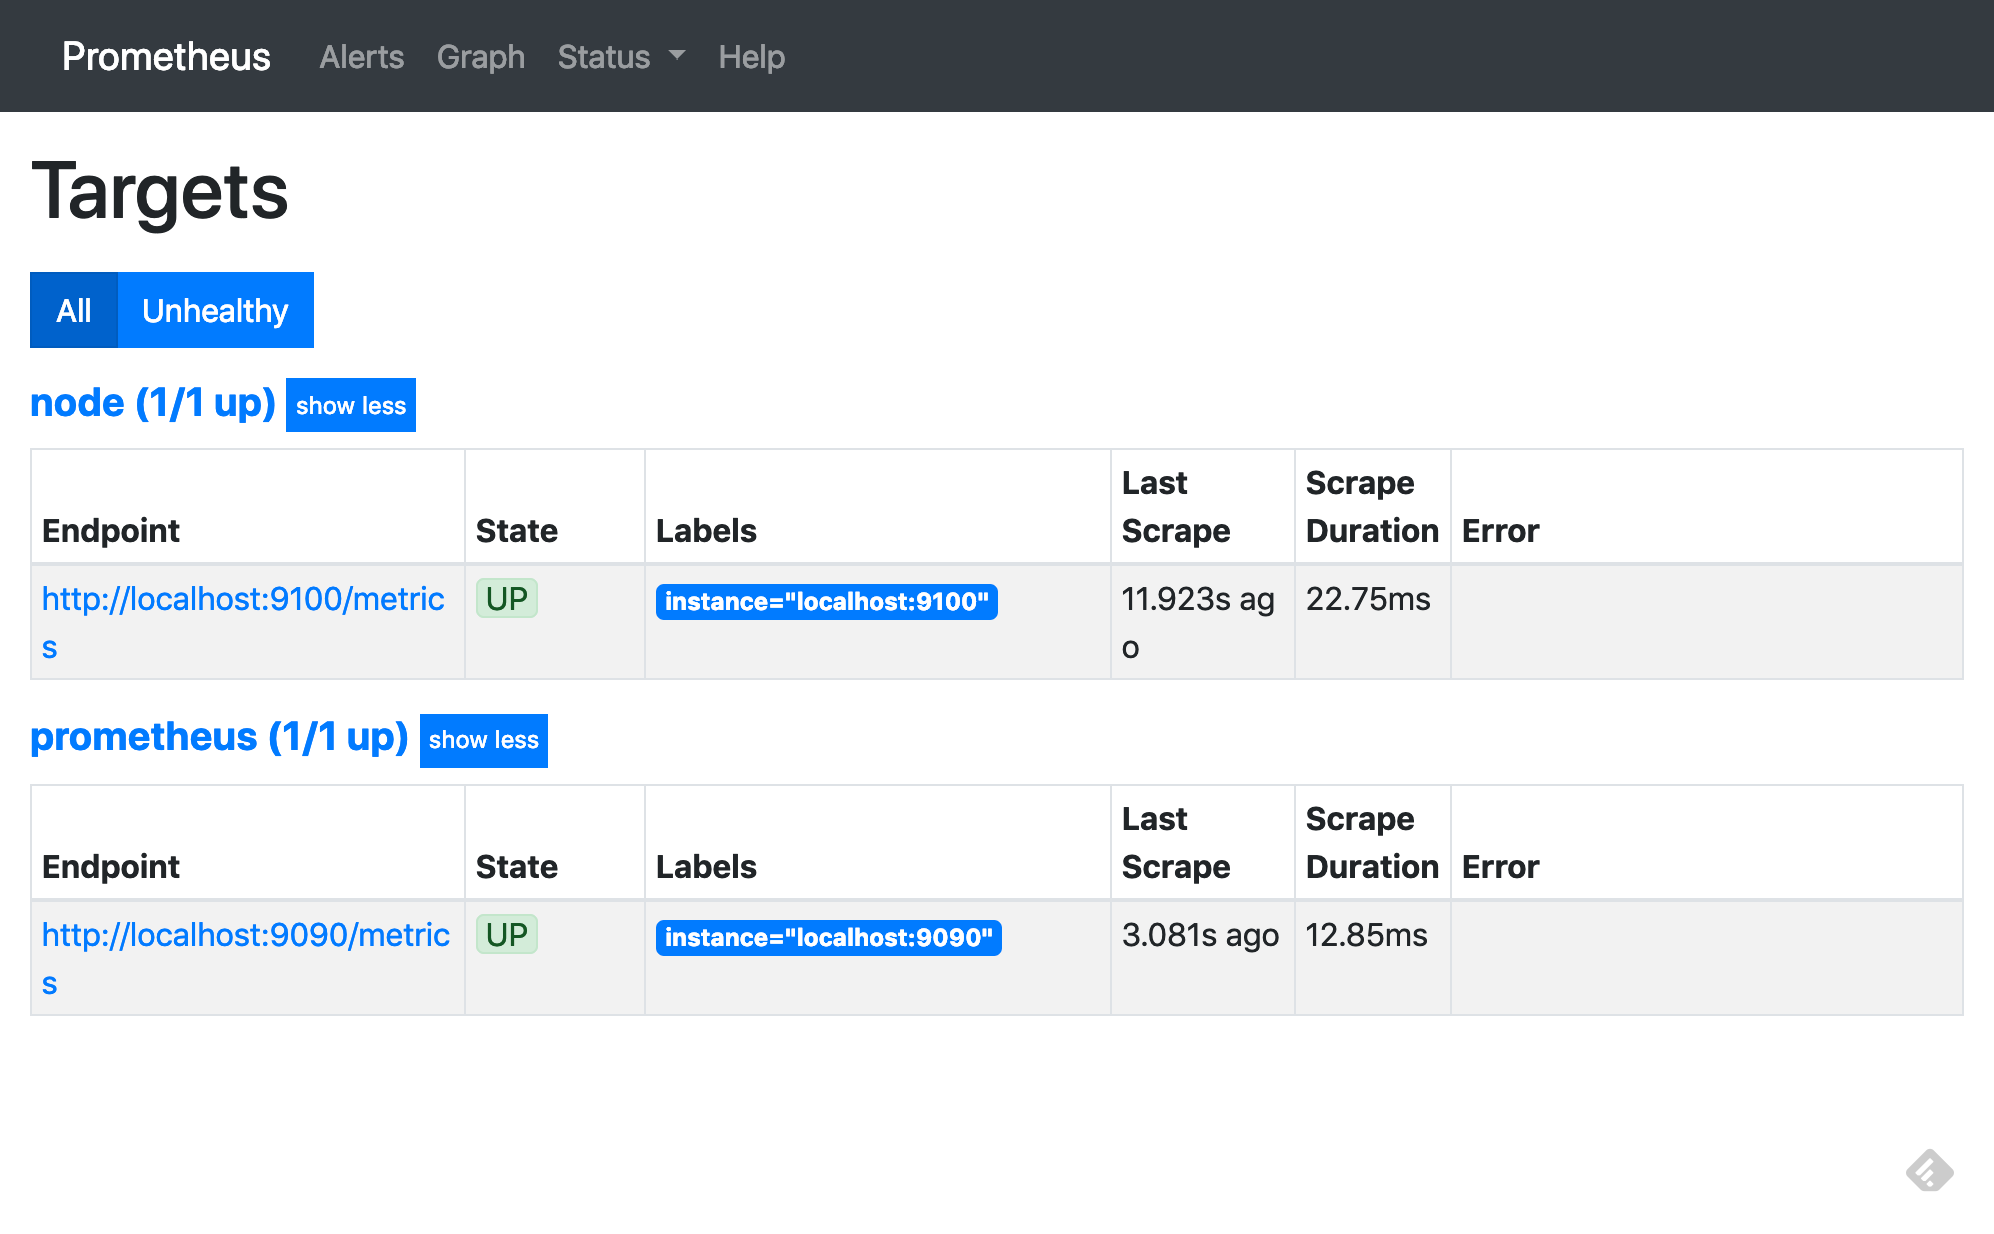
再起動後、Expression browserからStatus→Targetsをクリックすると、2つのTargetが表示され、両方のStateがUPになっています。
使ってみる
ここではNode exporter自体のメモリ使用量をグラフ表示してみます。
metricとしてprocess_resident_memory_bytes、label matcherとして job=”node”を指定します。
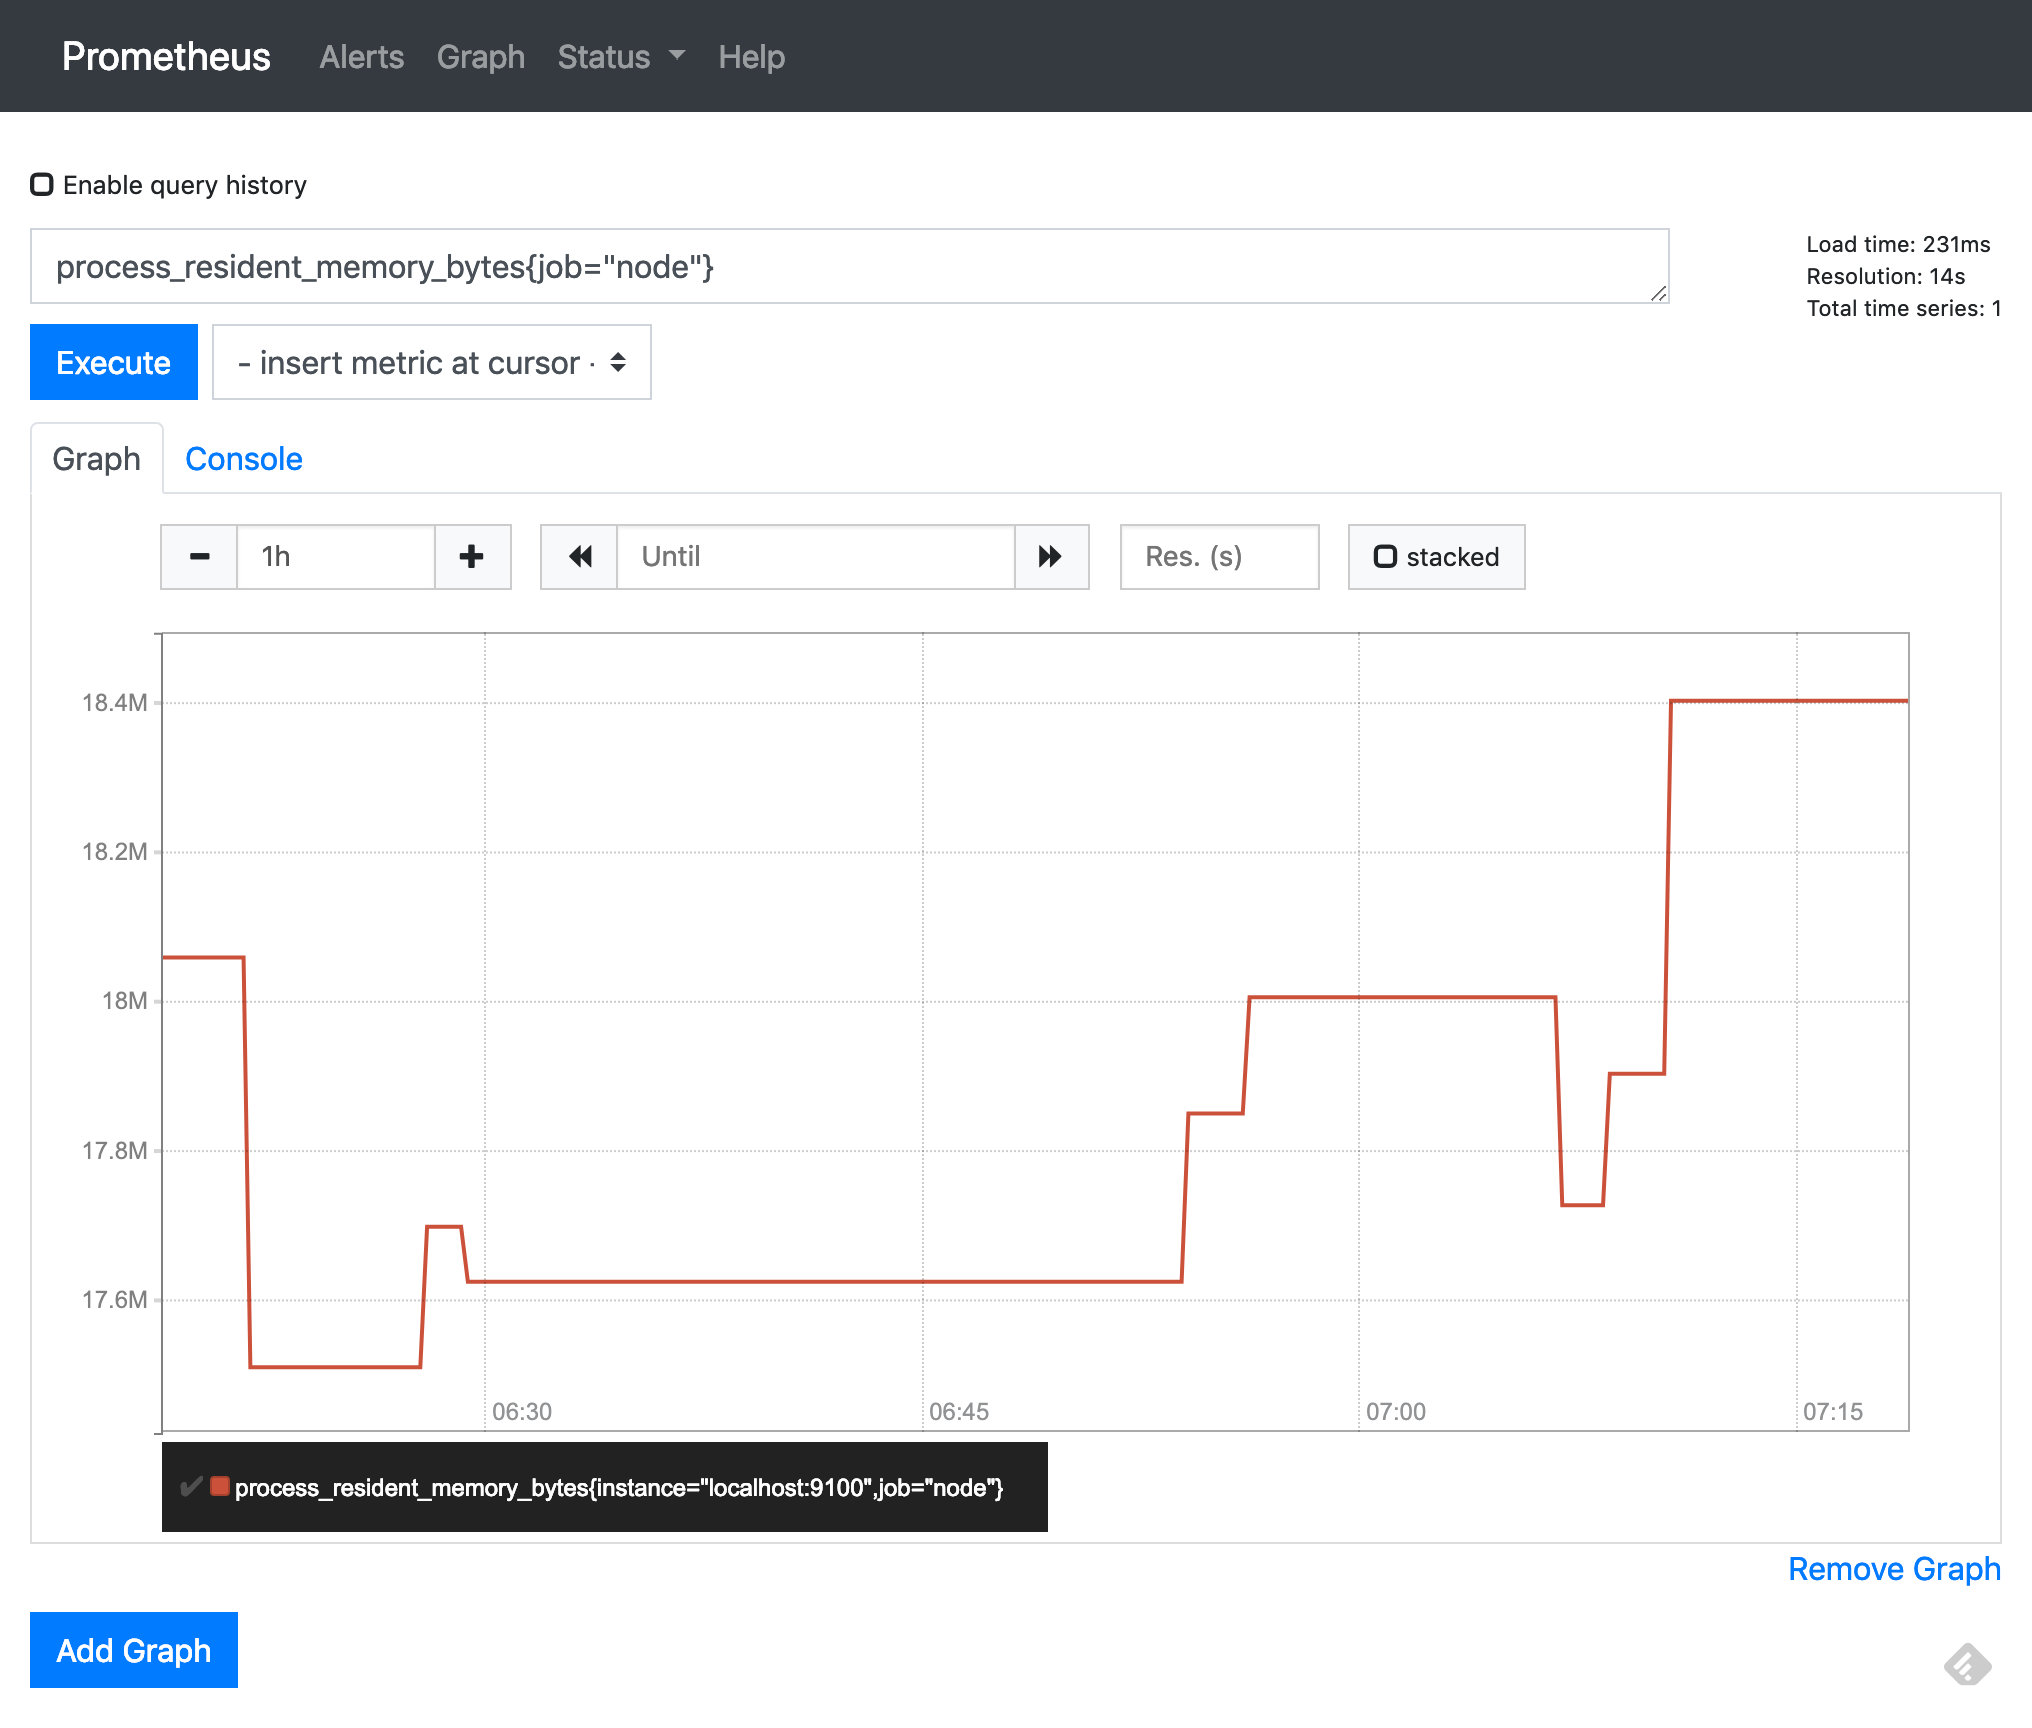
それっぽいグラフが表示されました。